What Is User Behavior Analytics Explained

Ever wondered why users do what they do on your website or app? That’s where User Behavior Analytics (UBA) comes in. It’s the art and science of tracking, collecting, and making sense of every user action to understand not just how they interact with your platform, but the why behind their clicks.
Think of it less like counting visitors and more like uncovering the story behind each user’s journey—what makes them happy, what frustrates them, and what ultimately leads them to convert or leave.
Decoding Digital Body Language
Imagine you’re a manager watching shoppers in your physical store. You wouldn't just count the number of people who walk in. You'd observe their paths, see where they linger, notice which products they pick up, and spot the confusing aisles that make them turn around.
That's exactly what UBA does for your digital storefront. It translates raw data—clicks, scrolls, mouse movements, and navigation choices—into a clear story about the user experience.

This goes way beyond simple metrics. Traditional analytics might tell you what happened, like "70% of users abandoned their shopping carts." But UBA helps you figure out why. Maybe a confusing checkout button led to a flurry of "rage clicks" before they gave up. That's the kind of insight that drives real improvement.
The Goals Behind The Analysis
The whole point of UBA is to stop guessing and start making decisions based on real evidence. The goals are pretty straightforward and incredibly powerful:
- Improve User Experience (UX): Find and eliminate friction points. Is there a broken link nobody is reporting? Is the navigation confusing? UBA shines a light on these issues so you can create a seamless journey.
- Boost Conversion Rates: By understanding what makes users convert, you can double down on what works and guide more people down those successful paths.
- Enhance Security: UBA is also a powerful security tool. By establishing a baseline for normal user behavior, it can quickly flag strange activity that might signal a hacked account or an insider threat.
Once a niche discipline, this field is now a massive market. The global behavior analytics market hit a value of USD 4.13 billion in 2024, and it's projected to grow exponentially as more businesses catch on. For a deeper dive into the fundamentals, this guide on what is behavioral analytics is a great starting point.
By learning to read this "digital body language," you can build better products, foster loyalty, and create experiences people genuinely love.
How User Behavior Analytics Actually Works
Ever wonder how your credit card company magically detects a fraudulent charge? It’s not magic. They start by learning your normal spending patterns—where you shop, how much you spend, what you buy. This creates a "baseline" of you. A sudden thousand-dollar purchase for scuba gear in another country? That's way off your baseline, and it triggers an alert.
User Behavior Analytics (UBA) applies that same core idea to digital products. It’s a process that methodically turns millions of clicks, scrolls, and hovers into a clear story about your users. It all starts with gathering the right information.
Stage 1: Data Collection
First things first, you have to collect the raw data from every single place a user interacts with your product. This isn't just about tracking page views; it’s about capturing the tiny, granular details of their journey. Think of it as setting up security cameras in your digital storefront to see absolutely everything.
Key data points usually include:
- Clickstream Data: Following the exact path a user takes, page by page, click by click.
- Mouse Movements: Watching where users move their cursor, where they hesitate, and what they hover over. This often reveals their focus or points of confusion.
- Scroll Depth: Measuring just how far down a page someone actually scrolls. Are they even seeing your brilliant call-to-action at the bottom?
- Time on Page: Understanding how long users stick around on certain pages or mess with specific features.
This infographic breaks down the simple three-step flow, from messy data collection to a clean, actionable alert.
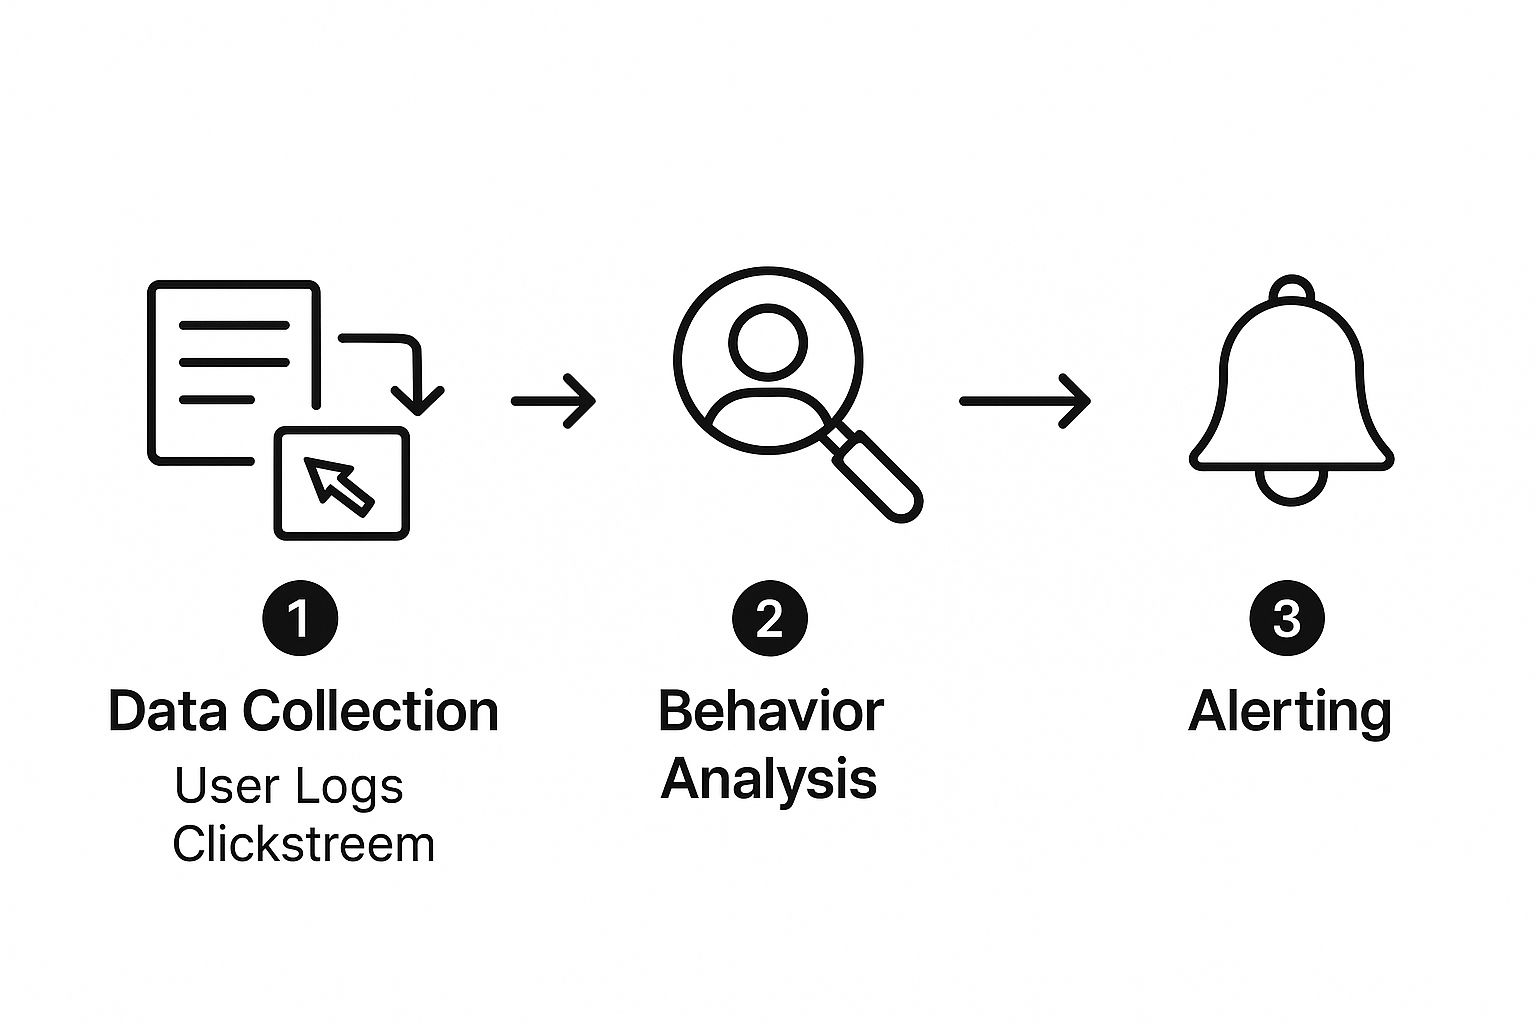
It really shows how raw, unstructured data gets systematically crunched down into a single, valuable insight.
Stage 2: AI-Powered Analysis
Once all that data is collected, the real fun begins. This is where Artificial Intelligence (AI) and machine learning algorithms step in to do the heavy lifting. These systems are designed to sift through enormous datasets to establish that crucial baseline of "normal" behavior for different user groups.
The system figures out what a typical user journey is supposed to look like. For an e-commerce site, that might be: Land on homepage > Search for "running shoes" > View three product pages > Add one to cart > Proceed to checkout.
Anything that strays too far from this established path gets flagged as an anomaly. Sometimes, an anomaly is a security red flag, like someone trying to log in from three different continents at once. More often, though, it’s a sign of user friction—like when dozens of people start repeatedly clicking on an image that isn't actually a button. We call that "rage clicking," and it’s a goldmine of insight.
Stage 3: Visualization and Insights
The final step is to make sense of it all. Raw data logs and spreadsheets are pretty useless to most people. UBA tools are built to translate complex patterns and anomalies into visuals that a human can actually understand and act on.
Dashboards bring these insights to life through things like:
- Heatmaps: These are color-coded maps of your pages, showing exactly where users are clicking, tapping, and focusing their attention.
- Session Replays: Think of these as video recordings of a user's entire session. You get to see your site through their eyes, watching every move they make.
- Funnel Analysis: These are simple charts that show you precisely where users are dropping off during a key process, like signing up for a trial or completing a purchase.
By turning a mountain of data into a clear story, UBA gives teams the power to spot real problems and make smart, informed decisions that actually improve the user experience.
UBA For Security and Growth
User Behavior Analytics (UBA) isn't a one-trick pony. Think of it as a tool with a split personality—it’s both a sharp-eyed security guard and a clever business strategist, working together. It serves two totally different, but equally crucial, jobs for any app or website: keeping things safe and finding ways to grow.
This approach takes you way beyond surface-level stats, giving you a complete picture of what’s really happening with your users.
On one hand, UBA is a non-negotiable part of modern cybersecurity. On the other, it hands your product and marketing teams the exact insights they need to build experiences people genuinely enjoy, which feeds directly into your bottom line.
Protecting Your Digital Fortress
Picture UBA as a digital detective. Your standard firewalls and security software are like the heavy-duty locks on your front door—they’re great, but they can't help you if a threat already has the key. This is where UBA shines.
It gets to know the normal, everyday habits of each user. It learns their rhythm. Then, it immediately flags any action that breaks from that established pattern. It's that gut feeling, but backed by data.
This is a game-changer for catching the sneaky threats that often slip by unnoticed:
- Insider Threats: An employee who suddenly starts digging into sensitive files at 3 AM from a coffee shop Wi-Fi? UBA spots that.
- Compromised Accounts: A user's account starts behaving erratically, performing actions that are completely out of character. UBA will raise the alarm.
- Credential-Based Attacks: Hackers using stolen login details but in a way that’s different from how the real owner acts. UBA can tell the difference.
Attacks like these are on the rise, making UBA a cornerstone of any serious security strategy. The global behavior analytics market was valued at USD 6.26 billion in 2025 and is expected to jump to USD 15.22 billion by 2030. That’s a massive leap, and it shows just how critical this technology has become.
Driving Growth and Improving Experience
Now, let's flip the coin. Beyond playing defense, UBA gives your marketing and product teams a direct line into the user's mind. It's the difference between knowing what happened and understanding why it happened.
Standard analytics might tell you users are dropping off. UBA shows you exactly where they get stuck, which features they can't get enough of, and what finally convinces them to convert.
Imagine UBA reveals that new users on a dating app almost always give up on the profile setup page when asked to write a bio. That’s pure gold. The product team can now zoom in on that specific step, figure out what the friction is, and fix it to make onboarding smoother for everyone.
This kind of deep understanding is the key to keeping users happy and sticking around. By pinpointing the annoying little friction points—like someone rage-clicking a broken button or ditching their cart at the last second—teams can stop guessing and start making smart, data-driven fixes.
This is a core principle behind all the best conversion rate optimization techniques. When you smooth out these small bumps in the road, you create a much better journey for your users, giving them every reason to stay and become loyal fans.
Real World Examples of UBA in Action
Theory is great, but seeing user behavior analytics deliver real-world results is what truly matters. It's time to move past the concepts and see how different industries are putting UBA to work every day.
These stories show businesses turning raw clicks and scrolls into a serious competitive advantage, often solving problems that traditional analytics would completely miss.
E-commerce Rescuing Abandoned Carts
An online clothing store was bleeding sales from abandoned carts. Their standard analytics showed that it was happening, but couldn't explain why. Users were adding items, heading to checkout, and then just vanishing. This is a classic case where UBA tools like heatmaps provide the missing piece of the puzzle.
A quick look at the heatmap revealed that a huge number of users were rage-clicking a non-interactive "Secure Checkout" badge, which was confusingly placed right next to the real "Proceed to Payment" button. They thought they were clicking the right thing, got frustrated when nothing happened, and bailed.
- The Problem: High cart abandonment with no obvious cause.
- UBA Insight: Heatmaps showed users hammering a confusing, non-functional design element.
- The Solution: The store redesigned the payment button, making it larger and impossible to miss. This simple fix, driven by a clear behavioral insight, immediately cut down on friction and recovered a ton of lost sales.
Banking Detecting Financial Fraud
For banks, UBA is a critical line of defense against fraud. They create a detailed baseline of normal behavior for every customer—tracking things like typical login times, locations, transaction amounts, and the devices they use.
If something deviates sharply from that established pattern, it triggers an instant alert. For example, if a customer who always logs in from a desktop in New York suddenly tries to access their account from a mobile device in another country at 3 AM, the system flags it as a high-risk event.
By focusing on the behavior rather than just the login credentials, banks can spot a compromised account even when a scammer has the correct username and password. It’s a proactive approach that stops theft before it can even happen.
SaaS Companies Refining Product Roadmaps
A Software-as-a-Service (SaaS) company wanted to figure out which features its most loyal, long-term customers actually used. They used UBA to segment their power users and trace their journeys through the app. The results were surprising.
The data showed that a secondary, almost-hidden feature was getting way more engagement than the main dashboard they'd spent so much time on. This insight was gold for their product roadmap. Instead of sinking resources into a dashboard redesign, they doubled down on expanding the feature their best customers already loved.
For a great example of how this kind of data can improve productivity, check out this piece on optimizing work patterns with data transparency.
This same principle is a game-changer in the dating app world, too. To see how these platforms use data to drive decisions, our guide on how the Tinder algorithm works breaks down how behavioral patterns directly impact your match success. In every case, UBA provides the "why" that leads to smarter, user-focused decisions.
The Behavioral Metrics That Actually Matter
If you really want to get what user behavior analytics is all about, you have to look past the usual suspects like page views or bounce rates. Those old-school metrics tell you what happened, but they leave out the most interesting part of the story: why it happened. UBA is all about the metrics that reveal a user's intent, their moments of frustration, and what truly grabs their attention.
This isn't just a small shift in thinking; it's a massive global movement. The way companies connect with customers is being completely reshaped by this deeper level of analysis. The market for user behavior analytics was valued at USD 1.10 billion in 2024 and is projected to skyrocket to USD 10.80 billion by 2032, all because businesses are finally getting serious about their digital experiences. You can dive into the numbers yourself in this global behavior analytics market report.
To make sense of it all, it helps to group these powerful metrics into a few key categories that answer specific, crucial questions about your users.
Measuring User Engagement and Interaction
This first bucket of metrics is all about figuring out how deeply people are actually using your product. Are they just window shopping, or are they really getting their hands dirty with the features you worked so hard to build?
- Feature Adoption Rate: This one’s simple but powerful. It tracks how many people actually try out a new feature after you launch it. It's the ultimate report card on whether your latest update landed well.
- Time to Value (TTV): Think of this as the "aha!" moment. TTV measures how long it takes a brand-new user to get the core benefit of your product. A fast TTV is a fantastic sign they'll stick around.
- Scroll Depth: This tells you how far down a page people are bothering to go. Are they seeing that all-important call-to-action at the bottom, or are they bailing before they get there?
A quick look at traditional analytics versus UBA makes the difference crystal clear. One tells you a number, the other tells you a story.
Traditional Analytics Vs User Behavior Analytics Metrics
| Metric Type | Traditional Analytics Example (The 'What') | UBA Example (The 'Why') |
|---|---|---|
| User Activity | Page Views: 10,000 people visited the pricing page. | Scroll Depth: Only 15% of users scrolled past the first plan to see the enterprise options. |
| Feature Usage | Click Count: The "Export" button was clicked 500 times. | Feature Adoption: 80% of new sign-ups used the "Invite Teammate" feature within their first day. |
| User Journey | Bounce Rate: 40% of users left after viewing one page. | Rage Clicks: A high number of users are repeatedly clicking a non-clickable image, showing design confusion. |
As you can see, UBA provides the context that turns raw data into actionable insights.
Identifying Conversion Friction Points
Where are people getting tripped up, confused, or just plain annoyed? These metrics are your friction detectors, helping you find and smooth out the rough patches in your user journey before they drive people away for good.
Rage clicks are probably the loudest signal of user frustration you can get. This happens when someone repeatedly smashes their mouse on an element, usually because they think it's a button when it's not. It’s a five-alarm fire indicating a major UI flaw.
Other crucial friction metrics include things like form abandonment rates (which tells you exactly which field made them give up) and error message frequency (where are users constantly hitting dead ends?). By keeping a close eye on these, you can pinpoint the exact moments of struggle and swoop in with a fix.
How To Implement A UBA Strategy
Jumping into user behavior analytics doesn't mean you have to rip up your current workflow and start from scratch. A smart implementation isn't about tracking everything all at once—that’s a recipe for getting lost in the data.
The real key is to start with a clear, focused plan. Aim for small, measurable wins to build momentum.
Choosing Your Tools and Staying Compliant
Before you even think about software, you need to define your goals. And I mean specific goals. "Improve UX" is way too vague to be useful.
Instead, aim for something tangible, like "reduce user onboarding friction by 20%" or "increase feature adoption for our new dashboard by 15%." Concrete goals give you a finish line to run towards.
Once you know what you’re trying to achieve, you can pick the right tools for the job. Some platforms are fantastic for session replays, while others are masters of heatmap analysis. Your choice should directly support the goals you just set. You might even explore how automation software can help streamline your data collection and reporting.
As you start gathering data, remember that privacy is everything. You absolutely cannot afford to mess this up. Trust is the foundation of your relationship with your users, and complying with regulations like GDPR and CCPA is non-negotiable.
Always be transparent with users about what data you are collecting and why. Anonymize personal data wherever you can, and make sure your privacy policies are clear, easy to find, and up-to-date. This isn't just about avoiding fines; it's about being a company people can trust.
Starting Small and Scaling Up
The best way to get started is to pick a single, focused project. Choose one of your clear goals and use your new UBA tool to zero in on that specific area. For instance, you could focus entirely on the checkout process to figure out why people are abandoning their carts.
Once you have solid insights and can show a real, tangible improvement, share those results with your team. This is how you get buy-in and prove that your efforts are paying off.
From there, you can start expanding your UBA strategy to other parts of your product or website, building on each success as you go.
Frequently Asked Questions About UBA
Alright, let's clear up some of the common questions that pop up around User Behavior Analytics. Think of this as the final piece of the puzzle to lock in your understanding.
UBA Versus Google Analytics
So, how is this different from something like Google Analytics? It’s a great question, and the answer is all about depth.
Google Analytics is fantastic at telling you what happened. It gives you the big picture numbers: how many people visited, where they came from, and which pages they looked at. It’s the high-level report.
UBA, on the other hand, tells you why it happened. It gets you down to the individual user’s perspective with tools like session replays and heatmaps. You’re not just seeing that 30% of users dropped off at checkout; you’re watching them rage-click a broken button that GA would never see.
Biggest Implementation Hurdles
Surprisingly, the toughest part of getting a UBA system running isn't the tech—it's the strategy. The single biggest mistake is diving in without a clear goal. If you don't know what you're trying to fix, you'll just drown in data.
Start with a specific target, like "I want to reduce checkout abandonment by 15%" or "find out why users aren't using our new feature." This focuses your efforts.
The other major hurdle is privacy. You have to be completely transparent with users and follow rules like GDPR. Getting insights is important, but never at the cost of user trust.
Benefits For Small Businesses
Is this just for big companies? Absolutely not. In fact, UBA can be a small business’s secret weapon. When you don't have the massive traffic of an enterprise, every single user interaction counts for so much more.
For a small business, UBA is like having a direct line into your customers' minds. It helps you understand your niche audience on a deep level, quickly spot frustrating bugs, and optimize your site for more sales without needing a huge budget. It’s about making smarter decisions with the resources you have.
How AI Enhances UBA
Think of AI as the supercharged engine that makes modern UBA possible. It would be impossible for a human to manually watch millions of user sessions.
AI does the heavy lifting. It automatically analyzes all that activity to figure out what "normal" behavior looks like. Then, its algorithms can instantly flag anything that deviates from that baseline—whether it's a potential fraudster or just a regular user getting hopelessly stuck on a confusing page. This saves an incredible amount of time and points you directly to the moments that matter most.
Ready to stop guessing and start winning on dating apps? Auto-Swiper uses smart automation to handle the swiping for you, so you can focus on making great connections. Get started today at https://auto-swiper.ch.